> ## Documentation Index
> Fetch the complete documentation index at: https://docs.chainstack.com/llms.txt
> Use this file to discover all available pages before exploring further.
# cryo with Chainstack: Blockchain data mastery in Python
> Use cryo with a Chainstack global elastic node to extract, filter, and analyze blockchain data in Parquet format using Python and the Polars library.
**TLDR**
* Integrate **cryo** (a Rust-based CLI for blockchain data extraction) with Python via **cryo\_python** for streamlined data collection and analysis.
* **cryo.collect()** fetches data into Python-friendly objects (Pandas, Polars, etc.) for real-time analysis, while **cryo.freeze()** saves data to files in JSON/Parquet/CSV.
* Combine Chainstack's high-performance Global Nodes with Python's libraries (pandas, matplotlib, etc.) to query, process, and visualize blockchain data with speed and precision.
## Main article
In blockchain data exploration, we previously introduced you to `cryo`, Paradigm's powerful command-line interface tool. As you might recall, this tool is a beacon for developers, researchers, and blockchain enthusiasts, optimizing the process of extracting data from various blockchain networks. Our initial journey through `cryo` revealed its data formatting efficiency and seamless integration with Chainstack [Global Nodes](/docs/global-elastic-node).
Learn how to use `cryo` and how it works with **[cryo: Your gateway to blockchain data](/docs/cryo-your-gateway-to-blockchain-data#basic-usage-of-cryo)**.
Now, we embark on a sequel, bridging `cryo` with the world of Python. This guide will show you how to use the Python wrapper made for the `cryo` CLI by covering setup, basic usage, and data extraction and manipulation using common Python libraries.
## Python and cryo for blockchain data manipulation
Python is known for its simplicity and data manipulation and analysis capability. The Python wrapper allows you to couple `cryo`'s Rust-based efficiency for data extraction with Python's data manipulation capabilities. This integration enhances the analytical power at your fingertips, allowing you to leverage Python's rich library ecosystem for in-depth data analysis, visualization, and machine learning.
## Prerequisites and setup
This section will lay the groundwork for integrating the `cryo` tool with Python. This process involves ensuring that your system has the necessary tools and libraries and installing the Python wrapper for `cryo`.
### Prerequisites
Before diving into the installation process, ensure your environment is primed for the task. The following prerequisites are essential:
* **Chainstack Global Node RPC**: Get a high-performance Chainstack [Global Node](/docs/global-elastic-node) RPC before starting.
Follow these steps to deploy an Ethereum node:
1. [Sign up with Chainstack](https://console.chainstack.com/user/account/create).
2. [Deploy a node](/docs/manage-your-networks).
3. [View node access and credentials](/docs/manage-your-node#view-node-access-and-credentials).
To follow this guide, deploy a **Standard** Ethereum node, which will default to a Global Node.
Once you deploy the node, you'll have access to an RPC endpoint, which will look like this:
```
https://ethereum-mainnet.core.chainstack.com/YOUR_CREDENTIALS
```
Create a `.env` file in your root directory and place the endpoint in it.
```python Python theme={"system"}
ETH_RPC="https://ethereum-mainnet.core.chainstack.com/YOUR_CREDENTIALS"
```
* **Rust**: Rust must be installed in your system for `cryo` to work, the Python integration is a lightweight wrapper for the `cryo` CLI, so you'll still need to meet the app's requirements.
Install Rust following the [rustup](https://rustup.rs/) instructions.
* **Python Environment**: Ensure that you have Python installed on your system and create a new virtual environment in your project's directory; you can run the following:
```bash Bash theme={"system"}
python3 -m venv cryo-and-python
```
Then activate the virtual environment with:
```bash Bash theme={"system"}
source cryo-and-python/bin/activate
```
* **Required Libraries**: `cryo_python` depends on several libraries, make sure to install the following libraries,
```bash Bash theme={"system"}
pip install maturin pandas polars pyarrow python-dotenv web3 matplotlib
```
Note that the `python-dotenv web3 matplotlib` libraries are not strictly required to run `cryo_python`, but we'll use them along the guide.
### Installation and Setup
With the prerequisites in place, let's move on to the installation steps:
1. **Clone the cryo Repository**: Use git to clone the `cryo` repository from GitHub. If you don't have git installed, you can download it from [git](https://git-scm.com/downloads).
```bash Bash theme={"system"}
git clone https://github.com/paradigmxyz/cryo
```
2. **Navigate to the Python Directory**:
```bash Bash theme={"system"}
cd cryo/crates/python
```
3. **Build** `cryo_python`:
* Run the `maturin` build command:
```bash Bash theme={"system"}
maturin build --release
```
* This command will compile the Rust code and create a wheel file (.whl) for the Python package.
4. **Install the Python Wrapper**:
* Find the `.whl` file generated by maturin. It will be located in the `target/wheels` directory.
* Install the wheel file using pip:
```bash Bash theme={"system"}
pip install --force-reinstall .whl
```
* Replace `` with the actual path to the `.whl` file generated, it will look like this:
```bash Bash theme={"system"}
/YOUR_PATH/cryo/target/wheels/cryo_python-0.3.0-cp310-cp310-macosx_11_0_arm64.whl
```
Your current draft provides a solid foundation. To enhance it, we can add more context and details based on the source files, particularly focusing on the functionality and technical nuances of `cryo.collect()` and `cryo.freeze()`. Here's an improved version:
## Basic Usage of `cryo_python`
`cryo_python` serves as a lightweight wrapper for the `cryo` CLI offers a seamless Python interface to the powerful CLI commands. With `cryo_python`users can access two principal functions that mirror their CLI counterparts:
* `cryo.collect()` extracts blockchain data and returns it as a Python-friendly data frame, enabling direct use within scripts for real-time analysis and manipulation.
* `cryo.freeze()` fetches data and saves it to a file, facilitating subsequent use or long-term storage.
Explore the source files for [cryo.collect()](https://github.com/paradigmxyz/cryo/blob/main/crates/python/python/cryo/_collect.py) and [cryo.freeze()](https://github.com/paradigmxyz/cryo/blob/main/crates/python/python/cryo/_freeze.py) in the GitHub repository.
### `cryo.collect()` Main Aspects
1. **Asynchronous Support**: `cryo.collect()` includes both `async_collect` and `collect` methods, designed to operate asynchronously. This feature is vital for efficiently handling large datasets or high-throughput tasks, ensuring optimal resource utilization and performance.
2. **Multiple Output Formats**: `cryo.collect()` allows you to organize data in various Python-friendly formats for diverse scenarios:
* **Polars DataFrame**: Ideal for high-performance data manipulation, leveraging its fast, efficient data handling capabilities.
* **Pandas DataFrame**: Provides broad compatibility with Python's extensive data analysis ecosystem.
* **List of Dictionaries**: Facilitates easy handling of JSON-like data structures, simplifying serialization.
* **Dictionary of Lists**: Offers an alternative structured data format suitable for specific data processing requirements.
### `cryo.freeze()` Main Aspects
1. **Data Type Flexibility**: `cryo.freeze()` can handle single and multiple data types, showcasing its versatility in accommodating various data collection needs.
2. **Argument Parsing**: Echoing `cryo.collect()`, `cryo.freeze()` also parses additional keyword arguments (`*kwargs`), enhancing the customization possibilities in data collection and storage.
### Usage examples
Having grasped the basics of **`cryo_python`**, let's get into practical examples to demonstrate its usage. Throughout this guide, we'll consistently retrieve the RPC endpoint from a **`.env`** file.
Ensure you have your RPC endpoint details in a `.env` file for these examples.
### `cryo.collect` basic example
Start by creating a file named **`main.py`** and paste the following code:
```python Python theme={"system"}
import os
import cryo
from dotenv import load_dotenv
# Load environment variables from .env file
load_dotenv()
# Retrieve the Ethereum RPC URL from environment variables
eth_rpc = os.getenv("ETH_RPC")
# Collect blockchain data using the cryo library and return it as a pandas DataFrame
# Specifying blocks range and output format
data = cryo.collect(
"blocks",
blocks=["18734050:18735050"],
rpc=eth_rpc,
output_format="pandas",
hex=True
)
# Displaying the column names of the DataFrame
print("Columns in the DataFrame:")
for column in data.columns:
print(column)
# Print the entire DataFrame
print(data)
```
Here's an explanation of how it works and what it does:
1. **Environment Setup**:
* The code starts by importing the necessary modules: `os` for environment variable management, `cryo` for accessing blockchain data, and `load_dotenv` from the `dotenv` package to load environment variables from a `.env` file.
* It then loads the environment variables using `load_dotenv()`, which reads the `.env` file and sets the variables.
2. **Accessing Ethereum RPC Endpoint**:
* The `ETH_RPC` variable, which contains the URL to an Ethereum RPC endpoint, is fetched from the environment variables using `os.getenv("ETH_RPC")`.
3. **Data Collection with `cryo.collect`**:
* The `cryo.collect` function has specific parameters to fetch data from the Ethereum blockchain.
* `datatype`: Set to `"blocks"`, indicating that the function should fetch data about blockchain blocks.
* `blocks`: Specifies the range of blocks to fetch data for (in this case, from block `18734050` to `18735050`).
* `rpc`: The Ethereum RPC endpoint URL, passed as `eth_rpc`.
* `output_format`: Set to `"pandas"`, indicating that the data should be returned as a Pandas DataFrame.
* `hex`: The boolean parameter set to `True` will return the data already converted to hexadecimal.
4. **Output**:
* The fetched data is stored in the variable `data`, a Pandas DataFrame.
* The script then prints the column names of the DataFrame to provide an overview of the data structure.
* Finally, it prints the DataFrame `data`, showing the fetched blockchain data.
The result of this script is a detailed listing of data for the specified range of Ethereum blocks. The DataFrame columns represent each block's attributes, such as `block_hash`, `author`, `block_number`, `gas_used`, `extra_data`, `timestamp`, `base_fee_per_gas`, and `chain_id`.
Here is an example of the output in the console:
```shell Shell theme={"system"}
Columns in the DataFrame:
block_hash
author
block_number
gas_used
extra_data
timestamp
base_fee_per_gas
chain_id
block_hash author ... base_fee_per_gas chain_id
0 0xdf6d5d7526eb50e68278998b2cc7a519a4c3daddb14a... 0xcdbf58a9a9b54a2c43800c50c7192946de858321 ... 37583327088 1
1 0x2818389bb471ebe60a74fb1865574c0ac50f40daf575... 0xdafea492d9c6733ae3d56b7ed1adb60692c98bc5 ... 38781853745 1
2 0xd65229e3d67c28f71b978ae789df6ee58c27420f8a35... 0x1f9090aae28b8a3dceadf281b0f12828e676c326 ... 38448400269 1
3 0x218f26e524d889d20604ad01b91feec5c2285dc3e747... 0x4675c7e5baafbffbca748158becba61ef3b0a263 ... 38316617096 1
4 0xace296b1c263fee4f35d831086c93aa820577dcc1bea... 0x388c818ca8b9251b393131c08a736a67ccb19297 ... 37638298982 1
.. ... ... ... ... ...
995 0xc59d9ad3444b0352c36f3ec7e3a3561bbc90d9118232... 0x690b9a9e9aa1c9db991c7721a92d351db4fac990 ... 71896254942 1
996 0xd611033a7769913ba0e8abdc8ae0ab0fee224435c512... 0x4838b106fce9647bdf1e7877bf73ce8b0bad5f97 ... 70283122265 1
997 0x2a4448fe72e37c169868e37ea4fce71789c31ecc9108... 0x95222290dd7278aa3ddd389cc1e1d165cc4bafe5 ... 73132855124 1
998 0x6ce066a304e334c6a98154b51f2a1b24edf749467424... 0x4838b106fce9647bdf1e7877bf73ce8b0bad5f97 ... 74400095143 1
999 0xbc293dc0e8d0a61f24256433f7faaf2a8e754a5557d9... 0x4838b106fce9647bdf1e7877bf73ce8b0bad5f97 ... 73090669589 1
[1000 rows x 8 columns]
```
Running this Python script is the equivalent of running this command from the `cryo` CLI directly:
```bash Bash theme={"system"}
cryo blocks --blocks 18734050:18735050 --rpc YOU_CHAINSTACK_NODE
```
Please note that Chainstack endpoints on the **Developer** plan are limited to 30 RPS, so you might need to add rate limiting to your code; starting from the [**Growth** plan](https://chainstack.com/pricing/), there is no rate limit.
To manage rate limits, **`cryo.collect`** can be adjusted using the `requests_per_second` parameter:
```python Python theme={"system"}
data = cryo.collect(
"blocks",
blocks=["18734050:18735050"],
rpc=eth_rpc,
output_format="pandas",
hex=True,
requests_per_second=25
)
```
### `cryo.freeze` basic example
The principle of **`cryo.freeze`** is quite similar to **`cryo.collect`**. In a new file, paste this code:
```python Python theme={"system"}
import os
from dotenv import load_dotenv
import cryo
# Load environment variables from the .env file
load_dotenv()
# Retrieve the Ethereum RPC URL from environment variables
eth_rpc = os.getenv("ETH_RPC")
# Fetch and save blocks data in JSON
data = cryo.freeze(
"blocks",
blocks=["18734050:18735050"],
rpc=eth_rpc,
output_dir="blocks_data/",
file_format="json",
hex=True,
requests_per_second=500
)
```
This script uses **`cryo.freeze`** to fetch and save the same block data as a JSON file in the specified directory. The logic and syntax closely follow the **`cryo`** CLI. The result is a JSON file containing data for the blocks in the `root/blocks_data/` directory.
Since both **`cryo.freeze`** and **`cryo.collect`** are just wrappers around the CLI; you can use the same commands. Let's explore a few more examples.
### Fetching ERC-20 balances with `cryo`
This section will guide you in using `cryo_python` to retrieve ERC-20 token balances from specified addresses and contracts. We'll get the balance of the [APECoin](https://etherscan.io/address/0x4d224452801ACEd8B2F0aebE155379bb5D594381) token in the [Binance](https://etherscan.io/token/0x4d224452801ACEd8B2F0aebE155379bb5D594381?a=0xf977814e90da44bfa03b6295a0616a897441acec) address in a range of 10,000 blocks.
Start by creating a new Python file and paste the following code:
```python Python theme={"system"}
import os
from dotenv import load_dotenv
import cryo
# Load environment variables
load_dotenv()
# Access Ethereum RPC URL from environment variables
eth_rpc = os.getenv("ETH_RPC")
# Fetch ERC-20 token balances for a specified address within a block range
data = cryo.freeze(
"erc20_balances",
blocks=["18.68M:18.69M"],
contract=['0x4d224452801ACEd8B2F0aebE155379bb5D594381'],
address=['0xF977814e90dA44bFA03b6295A0616a897441aceC'],
rpc=eth_rpc,
output_dir="blocks_data/",
file_format="json",
hex=True,
requests_per_second=900
)
```
Executing this script will generate a JSON file containing the ERC-20 balance data structured as follows:
```bash Bash theme={"system"}
Schema for ERC-20 Balances
─────────────────────────
- block_number: uint32
- erc20: hex
- address: hex
- balance_binary: binary
- balance_string: string
- balance_f64: float64
- chain_id: uint64
```
This structure, `erc20_balances`efficiently organizes ERC-20 balances by block, offering a clear and accessible format for data analysis.
Check the [`cryo` documentation](https://github.com/paradigmxyz/cryo?tab=readme-ov-file#cryo-datasets) to find what other datasets you can fetch.
## Fetch and manipulate blockchain data
Having explored the basic functionality of `cryo_python`, let's now get into a more advanced application by integrating it with essential Python libraries for data manipulation and visualization.
### Find the top 10 block authors
In this example, we'll fetch Ethereum blockchain data and visualize the top block authors using `cryo_python`, `pandas`, and `matplotlib`.
In a Python file, paste the following:
```python Python theme={"system"}
import os
import time
import pandas as pd
import matplotlib.pyplot as plt
from dotenv import load_dotenv
from web3 import Web3
import cryo
# Constants
ETH_RPC_VAR = "ETH_RPC"
LOOKBACK_BLOCKS = 5000
TOP_AUTHORS_COUNT = 10
# Load environment variables
load_dotenv()
# Function to get the block range
def get_block_range(web3, lookback_blocks):
latest_block = web3.eth.block_number
start_block = max(0, latest_block - lookback_blocks) # Avoid negative block numbers
return f"{start_block}:{latest_block}"
# Function to fetch data from cryo
def fetch_block_data(block_range, eth_rpc):
try:
# Start timer for fetching blocks
fetch_start_time = time.time()
# Fetch the block data
data = cryo.collect(
"blocks", blocks=[block_range], rpc=eth_rpc, output_format="pandas", hex=True
)
# Calculate and print the time taken to fetch the blocks
fetch_time = time.time() - fetch_start_time
print(f"Time taken to fetch blocks: {fetch_time:.2f} seconds")
return data
except Exception as e:
print(f"An error occurred while fetching block data: {e}")
return pd.DataFrame() # Return an empty DataFrame on error
# Function to plot the top authors
def plot_top_authors(data, num_entries):
top_authors = data['author'].value_counts().head(TOP_AUTHORS_COUNT)
plt.figure(figsize=(12, 6))
top_authors.plot(kind='bar')
plt.xticks(rotation=45, ha='right')
plt.title(f'Top {TOP_AUTHORS_COUNT} Authors by number of blocks mined from past {num_entries} blocks', fontsize=14)
plt.xlabel('Author', fontsize=14)
plt.ylabel('Number of Blocks', fontsize=14)
plt.tight_layout()
plt.show()
# Main execution
def main():
eth_rpc = os.getenv(ETH_RPC_VAR)
if not eth_rpc:
raise ValueError(f"Environment variable {ETH_RPC_VAR} not found")
w3 = Web3(Web3.HTTPProvider(eth_rpc))
if not w3.is_connected():
print("Failed to connect to Ethereum node.")
return
block_range = get_block_range(w3, LOOKBACK_BLOCKS)
print(f"Fetching blocks from {block_range} range.")
data = fetch_block_data(block_range, eth_rpc)
if not data.empty:
num_entries = len(data)
print(f"Number of blocks fetched: {num_entries}")
plot_top_authors(data, num_entries)
if __name__ == "__main__":
main()
```
Here's a step-by-step breakdown of what this script does:
1. **Setting Up the Environment**: We start by importing necessary libraries like `os`, `time`, `pandas`, `matplotlib.pyplot`, and `Web3`, along with `cryo`. Then, we define constants for the RPC URL, the number of blocks to look back on, and the number of top authors to display.
2. **Fetching Blockchain Data**: We define a function to determine the range of blocks to fetch based on the current block number. Another function uses `cryo.collect` to get data on these blocks and returns it as a pandas DataFrame. We track the time taken for this operation, offering insights into the performance of our data retrieval process.
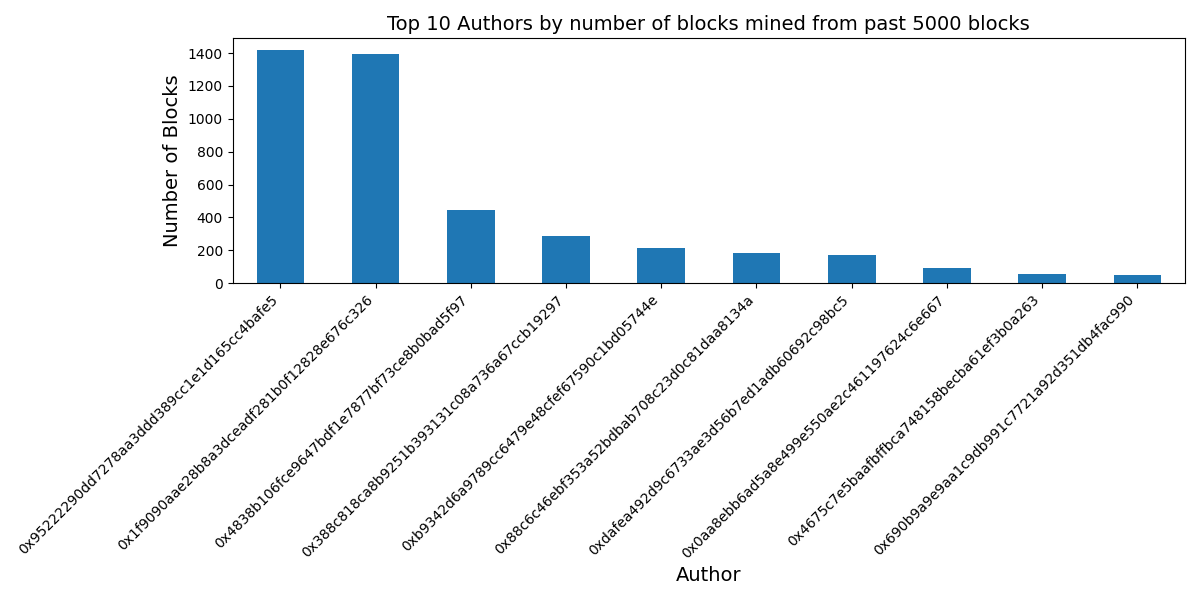
3. **Data Visualization**: With the blockchain data in hand, we analyze the top block authors using a function that counts the occurrences of each author in the data. We then use `matplotlib` to create a bar chart, showcasing the top authors based on the number of blocks mined.
4. **Executing the Script**: In the `main` function, we initialize a Web3 instance, connect to the Ethereum node, fetch the block data, and, if successful, visualize the top authors. We handle potential errors, such as missing environment variables or connection issues, to ensure robustness.
5. **Running the Code**: This script is designed as a standalone program. When executed, it will display a bar chart illustrating the most active Ethereum block authors over a specified block range.
This example demonstrates how to effectively combine `cryo` with other Python tools to fetch, process, and visualize Ethereum blockchain data, providing valuable insights into blockchain activity.
Here is an example of the console output and chart. The console will output something like the following:
```bash Bash theme={"system"}
Fetching blocks from 18874064:18879064 range.
Time taken to fetch blocks: 30.83 seconds
Number of blocks fetched: 5000
Top Authors by Number of Blocks Mined:
0x95222290dd7278aa3ddd389cc1e1d165cc4bafe5: 1417 blocks
0x1f9090aae28b8a3dceadf281b0f12828e676c326: 1385 blocks
0x4838b106fce9647bdf1e7877bf73ce8b0bad5f97: 443 blocks
0x388c818ca8b9251b393131c08a736a67ccb19297: 295 blocks
0xb9342d6a9789cc6479e48cfef67590c1bd05744e: 213 blocks
0x88c6c46ebf353a52bdbab708c23d0c81daa8134a: 183 blocks
0xdafea492d9c6733ae3d56b7ed1adb60692c98bc5: 175 blocks
0x0aa8ebb6ad5a8e499e550ae2c461197624c6e667: 89 blocks
0x4675c7e5baafbffbca748158becba61ef3b0a263: 55 blocks
0x690b9a9e9aa1c9db991c7721a92d351db4fac990: 52 blocks
```
And the chart will look like this:
 ### Visualise ERC-20 balance changes over time
The next example we'll work on will use the same `erc20_balances` dataset used in one of the previous examples. This time, we'll fetch and visualize how much [WETH](https://etherscan.io/token/0xc02aaa39b223fe8d0a0e5c4f27ead9083c756cc2) is in the[`WETH-USDT` pool](https://etherscan.io/address/0x0d4a11d5EEaaC28EC3F61d100daF4d40471f185) from Uniswap V2.
In a new file, paste the following code:
```python Python theme={"system"}
import os
import time
from dotenv import load_dotenv
import cryo
import pandas as pd
import matplotlib.pyplot as plt
import matplotlib.ticker as ticker
from web3 import Web3
# Constants
ETH_RPC_VAR = "ETH_RPC"
LOOKBACK_BLOCKS = 7200 # Approx a day in the past
CONTRACT_ADDRESS = '0xC02aaA39b223FE8D0A0e5C4F27eAD9083C756Cc2' # WETH
WALLET_ADDRESS = '0x0d4a11d5EEaaC28EC3F61d100daF4d40471f1852' # WETH-USDT pool Uniswap V2
# Initialize environment variables and Web3
load_dotenv()
eth_rpc = os.getenv(ETH_RPC_VAR)
w3 = Web3(Web3.HTTPProvider(eth_rpc))
def check_eth_rpc_connection(eth_rpc):
"""Check connection to Ethereum RPC."""
if not eth_rpc:
raise ValueError(f"Environment variable {ETH_RPC_VAR} not found")
if not w3.is_connected():
raise ConnectionError("Failed to connect to Ethereum node.")
def get_block_range(lookback_blocks):
"""Determine the range of blocks to fetch."""
latest_block = w3.eth.block_number
start_block = max(0, latest_block - lookback_blocks)
return f"{start_block}:{latest_block}"
def fetch_erc20_balances(block_range):
"""Fetch ERC-20 token balances within a given block range."""
return cryo.collect(
"erc20_balances",
blocks=[block_range],
contract=[CONTRACT_ADDRESS],
address=[WALLET_ADDRESS],
rpc=eth_rpc,
output_format="pandas",
hex=True,
requests_per_second=900 # Adapt the RPS to your endpoint
)
def convert_balance_to_ether(balance_str):
"""Convert balance from Wei to Ether, handling None values."""
return None if balance_str is None else Web3.from_wei(int(balance_str), 'ether')
def plot_balance_change_over_time(data):
"""Plot the balance change over time on a chart."""
plt.figure(figsize=(12, 6))
plt.plot(data['block_number'], data['balance_ether'], marker='o')
# Set axis labels and chart title with contract and address
plt.xlabel("Block Number")
plt.ylabel("Balance (Ether)")
plt.title(f"ERC-20 Token Balance Change for {CONTRACT_ADDRESS}\nWallet {WALLET_ADDRESS}")
# Manually set the x-axis ticks based on the block range
block_numbers = data['block_number']
tick_spacing = (block_numbers.max() - block_numbers.min()) // 10 # for example, 10 evenly spaced ticks
ticks = range(int(block_numbers.min()), int(block_numbers.max()), int(tick_spacing))
plt.xticks(ticks, [f"{tick:,.0f}" for tick in ticks])
# Format the y-axis to show balances rounded to 4 decimal places
plt.gca().yaxis.set_major_formatter(ticker.StrMethodFormatter('{x:,.4f}'))
# Add grid, tighten layout, and display the plot
plt.grid(True)
plt.tight_layout()
plt.show()
def main():
"""Main function to fetch and plot ERC-20 token balance changes."""
check_eth_rpc_connection(eth_rpc)
block_range = get_block_range(LOOKBACK_BLOCKS)
# Start timing the data fetch
start_time = time.time()
# Fetch the data
data = fetch_erc20_balances(block_range)
# End timing the data fetch
end_time = time.time()
elapsed_time = end_time - start_time
print(f"Data fetched in {elapsed_time:.2f} seconds.")
if data.empty:
print("No data available for plotting.")
return
# Prepare data for plotting
data = data[['block_number', 'erc20', 'address', 'balance_string']]
data['balance_ether'] = data['balance_string'].apply(convert_balance_to_ether)
data = data[data['balance_ether'].notnull()] # Filter out rows with None values
# Print data summary to the console
print("\nData summary:")
print(f"Block rage: {block_range}")
print(f"Start balance in Ether: {data.iloc[0]['balance_ether']}")
print(f"End balance in Ether: {data.iloc[-1]['balance_ether']}")
# Plot the balance changes over time
plot_balance_change_over_time(data)
if __name__ == "__main__":
main()
```
Here's a step-by-step explanation of what's going on:
1. **Fetch Block Range**:
* It calculates the range of blocks to query by finding the latest block number and subtracting the lookback period to determine the start block; in the example, we analyze about a day's worth of blocks.
2. **Fetch ERC-20 Balances**:
* The script fetches ERC-20 token balance data from the specified contract, wallet address, and block range. The `cryo.collect` function is called, and the data is returned in a pandas DataFrame format.
3. **Data Conversion and Cleaning**:
* A conversion function transforms balance values from Wei (the smallest unit of Ether) to Ether for readability. It handles any `None` values to avoid errors during conversion.
4. **Summarizing Data**:
* The script prints out a summary of the data to the console, including the block range and the start and end balances in Ether, providing a quick overview of the dataset.
5. **Data Visualization**:
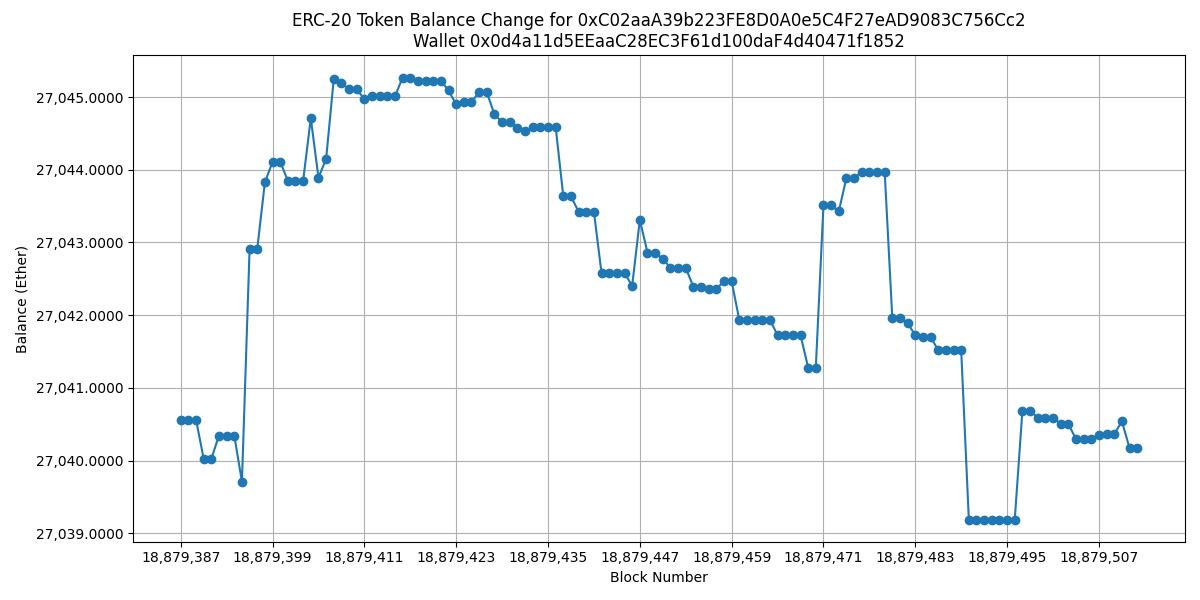
* It then plots the balance changes over time using `matplotlib`. The x-axis represents block numbers, and the y-axis represents the balance in Ether.
* The axis tick labels are formatted for better readability, and the chart is titled with the contract and wallet address for reference.
Remember to adapt the request per second.
Here is an example of the result:
```python Python theme={"system"}
Data fetched in 16.51 seconds.
Data summary:
Block rage: 18872292:18879492
Start balance in Ether: 27034.167858289615425314
End balance in Ether: 27039.186876795597977365
```
Graph for the balance change over a day:
### Visualise ERC-20 balance changes over time
The next example we'll work on will use the same `erc20_balances` dataset used in one of the previous examples. This time, we'll fetch and visualize how much [WETH](https://etherscan.io/token/0xc02aaa39b223fe8d0a0e5c4f27ead9083c756cc2) is in the[`WETH-USDT` pool](https://etherscan.io/address/0x0d4a11d5EEaaC28EC3F61d100daF4d40471f185) from Uniswap V2.
In a new file, paste the following code:
```python Python theme={"system"}
import os
import time
from dotenv import load_dotenv
import cryo
import pandas as pd
import matplotlib.pyplot as plt
import matplotlib.ticker as ticker
from web3 import Web3
# Constants
ETH_RPC_VAR = "ETH_RPC"
LOOKBACK_BLOCKS = 7200 # Approx a day in the past
CONTRACT_ADDRESS = '0xC02aaA39b223FE8D0A0e5C4F27eAD9083C756Cc2' # WETH
WALLET_ADDRESS = '0x0d4a11d5EEaaC28EC3F61d100daF4d40471f1852' # WETH-USDT pool Uniswap V2
# Initialize environment variables and Web3
load_dotenv()
eth_rpc = os.getenv(ETH_RPC_VAR)
w3 = Web3(Web3.HTTPProvider(eth_rpc))
def check_eth_rpc_connection(eth_rpc):
"""Check connection to Ethereum RPC."""
if not eth_rpc:
raise ValueError(f"Environment variable {ETH_RPC_VAR} not found")
if not w3.is_connected():
raise ConnectionError("Failed to connect to Ethereum node.")
def get_block_range(lookback_blocks):
"""Determine the range of blocks to fetch."""
latest_block = w3.eth.block_number
start_block = max(0, latest_block - lookback_blocks)
return f"{start_block}:{latest_block}"
def fetch_erc20_balances(block_range):
"""Fetch ERC-20 token balances within a given block range."""
return cryo.collect(
"erc20_balances",
blocks=[block_range],
contract=[CONTRACT_ADDRESS],
address=[WALLET_ADDRESS],
rpc=eth_rpc,
output_format="pandas",
hex=True,
requests_per_second=900 # Adapt the RPS to your endpoint
)
def convert_balance_to_ether(balance_str):
"""Convert balance from Wei to Ether, handling None values."""
return None if balance_str is None else Web3.from_wei(int(balance_str), 'ether')
def plot_balance_change_over_time(data):
"""Plot the balance change over time on a chart."""
plt.figure(figsize=(12, 6))
plt.plot(data['block_number'], data['balance_ether'], marker='o')
# Set axis labels and chart title with contract and address
plt.xlabel("Block Number")
plt.ylabel("Balance (Ether)")
plt.title(f"ERC-20 Token Balance Change for {CONTRACT_ADDRESS}\nWallet {WALLET_ADDRESS}")
# Manually set the x-axis ticks based on the block range
block_numbers = data['block_number']
tick_spacing = (block_numbers.max() - block_numbers.min()) // 10 # for example, 10 evenly spaced ticks
ticks = range(int(block_numbers.min()), int(block_numbers.max()), int(tick_spacing))
plt.xticks(ticks, [f"{tick:,.0f}" for tick in ticks])
# Format the y-axis to show balances rounded to 4 decimal places
plt.gca().yaxis.set_major_formatter(ticker.StrMethodFormatter('{x:,.4f}'))
# Add grid, tighten layout, and display the plot
plt.grid(True)
plt.tight_layout()
plt.show()
def main():
"""Main function to fetch and plot ERC-20 token balance changes."""
check_eth_rpc_connection(eth_rpc)
block_range = get_block_range(LOOKBACK_BLOCKS)
# Start timing the data fetch
start_time = time.time()
# Fetch the data
data = fetch_erc20_balances(block_range)
# End timing the data fetch
end_time = time.time()
elapsed_time = end_time - start_time
print(f"Data fetched in {elapsed_time:.2f} seconds.")
if data.empty:
print("No data available for plotting.")
return
# Prepare data for plotting
data = data[['block_number', 'erc20', 'address', 'balance_string']]
data['balance_ether'] = data['balance_string'].apply(convert_balance_to_ether)
data = data[data['balance_ether'].notnull()] # Filter out rows with None values
# Print data summary to the console
print("\nData summary:")
print(f"Block rage: {block_range}")
print(f"Start balance in Ether: {data.iloc[0]['balance_ether']}")
print(f"End balance in Ether: {data.iloc[-1]['balance_ether']}")
# Plot the balance changes over time
plot_balance_change_over_time(data)
if __name__ == "__main__":
main()
```
Here's a step-by-step explanation of what's going on:
1. **Fetch Block Range**:
* It calculates the range of blocks to query by finding the latest block number and subtracting the lookback period to determine the start block; in the example, we analyze about a day's worth of blocks.
2. **Fetch ERC-20 Balances**:
* The script fetches ERC-20 token balance data from the specified contract, wallet address, and block range. The `cryo.collect` function is called, and the data is returned in a pandas DataFrame format.
3. **Data Conversion and Cleaning**:
* A conversion function transforms balance values from Wei (the smallest unit of Ether) to Ether for readability. It handles any `None` values to avoid errors during conversion.
4. **Summarizing Data**:
* The script prints out a summary of the data to the console, including the block range and the start and end balances in Ether, providing a quick overview of the dataset.
5. **Data Visualization**:
* It then plots the balance changes over time using `matplotlib`. The x-axis represents block numbers, and the y-axis represents the balance in Ether.
* The axis tick labels are formatted for better readability, and the chart is titled with the contract and wallet address for reference.
Remember to adapt the request per second.
Here is an example of the result:
```python Python theme={"system"}
Data fetched in 16.51 seconds.
Data summary:
Block rage: 18872292:18879492
Start balance in Ether: 27034.167858289615425314
End balance in Ether: 27039.186876795597977365
```
Graph for the balance change over a day:
 As you can see, we can use `cryo` to fetch data and manipulate it with Python, a very powerful combo.
## Conclusion
The integration of `cryo` with Python is a significant advancement for blockchain data analysis. It combines `cryo`'s efficient data extraction capabilities with Python's powerful data processing and visualization tools. This synergy, coupled with high-performance Chainstack Global Nodes, enables users to easily extract, analyze, and visualize blockchain data, making it an invaluable resource for developers, researchers, and enthusiasts in the blockchain community. The practical examples demonstrate this integration's real-world utility, highlighting its potential to yield insightful and actionable information from complex blockchain datasets. In essence, `cryo` and Python offer an effective and accessible platform for in-depth blockchain data exploration.
### About the author
As you can see, we can use `cryo` to fetch data and manipulate it with Python, a very powerful combo.
## Conclusion
The integration of `cryo` with Python is a significant advancement for blockchain data analysis. It combines `cryo`'s efficient data extraction capabilities with Python's powerful data processing and visualization tools. This synergy, coupled with high-performance Chainstack Global Nodes, enables users to easily extract, analyze, and visualize blockchain data, making it an invaluable resource for developers, researchers, and enthusiasts in the blockchain community. The practical examples demonstrate this integration's real-world utility, highlighting its potential to yield insightful and actionable information from complex blockchain datasets. In essence, `cryo` and Python offer an effective and accessible platform for in-depth blockchain data exploration.
### About the author
 Developer Advocate @ Chainstack
BUIDLs on EVM, The Graph protocol, and Starknet
Helping people understand Web3 and blockchain development