- Chainstack Compare provides real-time RPC provider performance — availability, latency (P50/P95/P99), success rates, and transaction confirmation — for major providers across multiple blockchains and regions.
- Built with Vercel (data collection) and Grafana Cloud (dashboards), it refreshes data every 1–3 minutes and keeps 14 days of history.
- The landing page ranks providers at a glance per network; one more click opens the full Grafana dashboard with per-method and per-region breakdowns.
- The ranking system prioritizes fast, reliable providers, while special metrics (e.g., transaction landing on Solana) help fine-tune your choice of provider.
- Fork the GitHub repository for full technical details and customization of this open dashboard solution.
Problem
Choosing the right RPC provider for your blockchain or trading project can be challenging. Performance varies by region and protocol, and it changes over time. How do you make an informed decision? Chainstack Compare solves this problem by providing real-time performance data for major RPC providers across different regions and blockchains. The dashboard has been built with the help of Vercel (Pro plan) and Grafana Cloud (Free plan). You can either use the dashboard hosted by Chainstack or fork the GitHub repository and customize it to your needs.Run nodes on Chainstack
Start for free and get your app to production levels immediately. No credit card required. You can sign up with your GitHub, X, Google, or Microsoft account.Solution overview
The solution consists of the two main components: data collection services and dashboard. The data collection service sends API calls to all providers, measures response times, and pushes collected data to the dashboard every 1–3 minutes. The data collection service only records response times and marks requests based on whether they were successful or not. All calculations, including averages and other aggregated values, are performed by the dashboard.Quick start
- Visit Chainstack Compare
- Select your blockchain network — Ethereum, Solana, BNB Chain, Arbitrum, Base, TON, Hyperliquid, or Monad
- Review the provider ranking, availability, and latency (P50/P95/P99) per region, and switch between the 24h and 7d windows
- For per-method breakdowns and success rates, open the linked Grafana dashboard
What you can do
With Chainstack Compare Dashboard, you can:- Compare RPC provider availability and latency (P50/P95/P99) across regions
- Monitor response times and success rates
- Open per-method breakdowns in the Grafana dashboard
- Monitor transaction confirmation metrics (Solana only)
- Blockchains: Ethereum, Solana, BNB Chain, Arbitrum, Base, TON, Hyperliquid, Monad
- Regions: United States, Germany, Singapore
- Providers (vary by network): Alchemy, Chainstack, QuickNode, Helius, dRPC, TonCenter
Data and paid tiers
All metrics, except for the transaction landing metrics, are updated every 1–3 minutes, with 14 days of historical data available. The transaction landing metrics are updated every 15 minutes.For the dashboard, we used paid tiers of the mentioned providers, except for TonCenter where we used the free tier.Special features
Provider ranking
We evaluate RPC providers based on their speed (response time) and reliability (success rate) across three regions to rank them in each region and globally. Transaction landing metrics are not considered for this ranking.- The lower the score, the better the provider
- Even small success rate drops (99% vs 97%) significantly impact the final score
- Performance is measured equally across all regions
Solana: transaction landing
We send standardized test transactions every 15 min across the Solana network to measure two metrics:- Slot Latency The time it takes for a transaction to be confirmed on the network, measured in slots. Lower slot latency means faster transaction finality.
- Landing Rate The percentage of transactions that successfully confirm within our testing parameters. This metric helps identify reliable providers for your specific region.
- Uses the Solana Memo Program for consistent, lightweight operations
- Includes fixed priority fees (200,000 microlamports/CU)
- Has the 55 sec timeout
How it works
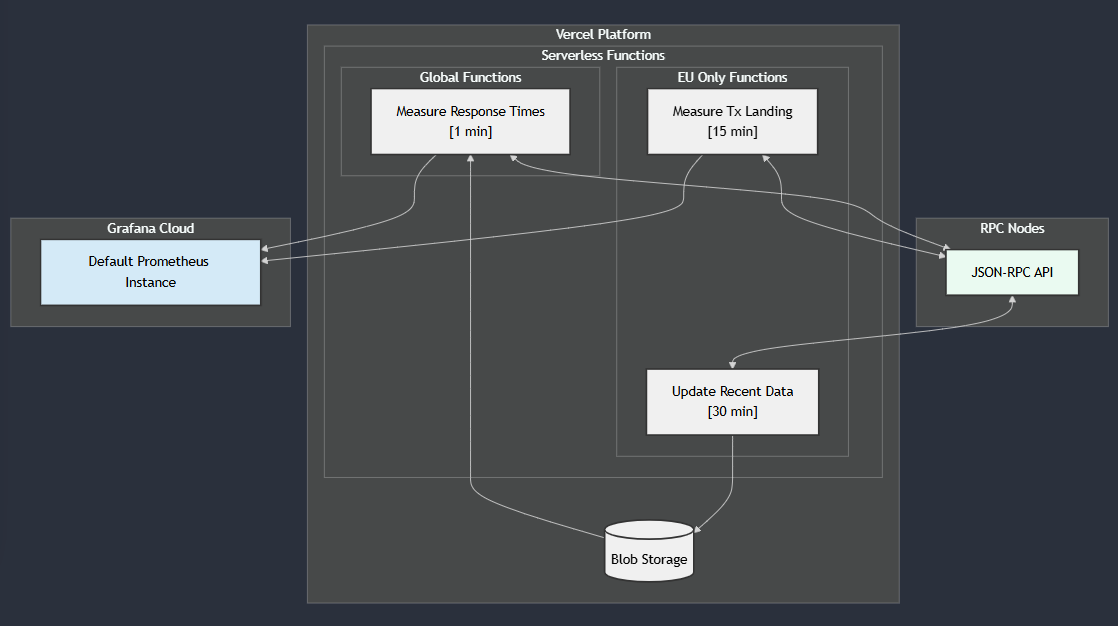
Vercel: data collection services
We chose Vercel as our hosting solution due to its simplicity and time-to-production. The data collection services are Vercel serverless functions deployed to multiple regions. Metrics for each blockchain are collected by a dedicated function which is triggered by Vercel cron jobs every 1–3 minutes. Once data is collected, it is pushed to a Grafana Cloud Prometheus instance. The service has the following performance thresholds:- Response timeout: 55 seconds
- Block delay threshold: 55 seconds
- Timeouts and excessive block delays
- Non-200 HTTP responses
- JSON-RPC error responses
Grafana Cloud: dashboards
Grafana Cloud with its hosted Prometheus instance providers hassle-free services. Thanks to it, we can focus on the dashboard quality, rather than on supporting a Prometheus instance. Grafana Cloud stores dashboard configurations as JSON files, which makes it easier to support and improve them. Data transformation required for some charts is performed with the help of Grafana Data Transformation feature and PromQL. Historical data is available for the last 14 days.For developers
- Complete technical documentation
- Setup instructions
- Configuration guidelines
FAQ
What providers do you monitor?
What providers do you monitor?
Alchemy, Chainstack, QuickNode, Helius, dRPC, and TonCenter. Paid tiers (except for TonCenter). Provider coverage varies by network.
Why do I need this dashboard?
Why do I need this dashboard?
It helps choose the right RPC provider based on real data and monitor their performance across regions.
How often is data updated?
How often is data updated?
Every 1–3 minutes; the landing page refreshes every 3 minutes. Transaction landing metrics update every 15 minutes.
What counts as a failed request?
What counts as a failed request?
Any response slower than 55 seconds, non-200 status codes, or responses containing error messages (as per JSON-RPC specification). For blocks, delays over 55 seconds count as failures.
Can I see historical data?
Can I see historical data?
Yes. The landing page shows 24h and 7d views, and the Grafana dashboard keeps 14 days of performance history.
How do you collect the metrics?
How do you collect the metrics?
We use serverless functions in three regions, measuring response times and success rates from each location.
What API methods do you test?
What API methods do you test?
We focus on commonly used methods like balance checks, transaction simulation, and block queries. Each blockchain has its specific set of tested methods.
What's the difference between global and regional views?
What's the difference between global and regional views?
Global shows aggregated performance across all regions, while regional views provide detailed metrics for specific locations.